Now that we’ve highlighted the important vocabulary used in Discounted Cash Flow modeling, we can build a model for Gamestop.
The goal of the DCF is to find the value of the company based on its future profit discounted at some rate to factor in the uncertainty of those profits. This “value” is called “intrinsic value”, which is different from the “market value” of the company. In the marketplace, anyone can buy the company or its stock for whatever someone is willing to sell to them at a “market price”. This can be unrelated to how much money the business actually makes.
The key points to remember are that although the market value can be unrelated to the health of a business, it can be easily seen in the market. The intrinsic value is how much a company is actually worth based on how much money it will make, but predicting the future is harder to see.
Given the information that companies are required by law to publish about themselves (the accounting statements in SEC filings), how can we divine the intrinsic value of a company?
This is done by taking the company’s revenues and removing all of the expenses that affect its cash until you are left with the Free Cash Flow. Finding how much cash a company makes is vital to its intrinsic value.
To get the actual numbers to plug into the DCF, we pull from the publicly published accounting statements.
In arithmetical terms along with the accounting statements where the data can be found, the DCF formula is:
Revenue (*Income Statement*)
-Cost of Revenue (*Income Statement*)
=Gross Profit
-SG&A (*Income Statement*)
=EBITDA
-D&A (*Income Statement*)
=EBIT
-Taxes (*Your Choice or Income Statement*)
=EBIAT
+D&A (*Income Statement*)
-Capex (*Cash Flow Statement*)
-Increase in NWC (*Balance Sheet*)
=Free Cash Flow
The DCF model is generally built using annual data, so taking these data points from one year’s SEC filings will give you one year’s Free Cash Flow.
But the company’s intrinsic value isn’t really determined by what happened in the past! What we want to know is how a business will do in the future after we’ve invested our money. As I pointed out in the introduction, we obviously don’t know the future, so the best we can do is use past performance, along with our educated guesses (hence the thesis and researched supporting arguments), to predict the future.
In a typical DCF model, you will want to run the above Free Cash Flow formula on multiple previous years, taking your data from those years’ publicly available financial paperwork. I have done this for Gamestop using the years 2008-2012 (the numbers are measured in millions):
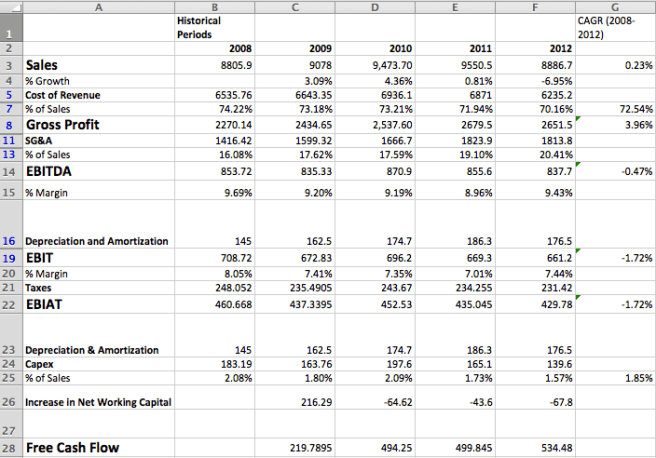
Some things to point out from this historical data:
- While revenue growth between 2008 to 2012 was almost flat (rising until 2011 then falling dramatically in 2012, possibly due to consumers waiting for the new gaming systems), SG&A expenses rose by $400 million over this period.
- EBIAT has decreased from 2008 to 2012.
- Capital Expenditures decreased from 2008 to 2012, which helped free up cash for the shareholders but could also signal decreased investment back into the business.
- Despite the increase in SG&A and flat Earnings metrics, Free Cash Flow has more than doubled over the past five years, a good sign for stockholders.
On the far right I have included a column with the Compound Annual Growth Rate (CAGR) of the various financial data to show how these parts of the Gamestop business have grown over the past five years. We can use these growth rates to attempt to predict into the future, along with our own modifications based on our beliefs in the future of the business.
Next: Net Working Capital
Previous: DCF Glossary
