Increase in Net Working Capital: Increase in Net Working Capital is the most complicated of our future projections. This is because to properly find future NWC, you have to predict future Current Assets and future Current Liabilities.
To accomplish this, I added a “NWC” spreadsheet to my Excel workbook:
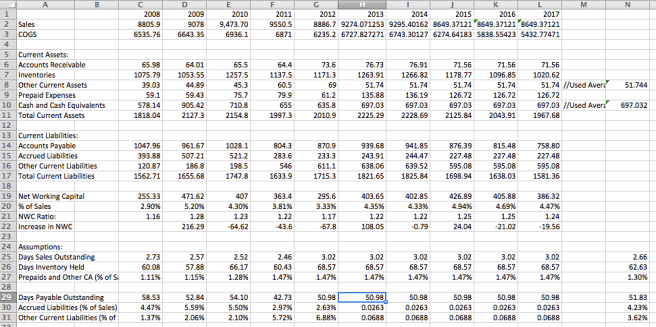
All of the numbers in the 2008 through 2012 columns were taken from the 2008 through 2012 Gamestop Balance Sheets. The projections for the 2013-2017 values are found by taking the average growth rates or most recent value for the assets and liabilities and using those values or rates in future years.
The spreadsheet provides a visual for what makes up Current Assets and Current Liabilities. In English, they are:
Current Assets:
Accounts Receivables: Amounts owed to the company for products or services it has given on credit to other business or individuals.
Inventories: Inventories are the company’s raw materials and products made or in the process of being made.
Prepaid Expenses: These are expenses paid by the company before receiving the products or services for which it has paid. An example of a prepaid expense is an insurance premium which is paid completely upfront but covers a company or person for some amount of time such as a year. The insurance is a prepaid expense which initially is an asset that will get used over the course of the year, decreasing the asset over that time.
Cash and Cash Equivalents: The company’s cash and assets that can almost immediately be turned into cash, such as commercial paper and Treasury Bills.
Other Current Assets: Assets that do not fall into the above categories but are still assets that can be turned into cash within a year. These kinds of assets are typically non-recurring or not large enough to require their own category on the balance sheet. Some examples of this could be cash paid in advance to suppliers or employees that is accounted separately from the rest of the company’s cash or small investments in other companies or assets the company has made.
Current Liabilities:
Accounts Payable: Payments owed to the company for products or services already provided to a customer. This can be thought of in non-accounting terms as customers’ unpaid bills.
Accrued Liabilities: Expenses such as salaries, rent, interest, and taxes that the company owes but has not yet paid.
Other Current Liabilities: Other types of liabilities that don’t fit into one of the other categories, possibly don’t occur very often, and are due to be paid or worked off within a year.
Assumptions:
Day Sales Outstanding (DSO): DSO tells you how a company is managing its Account Receivables. The lower the number, the faster the company is getting paid by its customers. The equation for DSO is: (AR/Sales) * 365.
Days Inventory Held (DHI): DHI tells you how a company is managing its Inventory. The lower the number, the faster the company is selling or getting rid of its old product inventory. The equation for DHI is: (Inventory/Cost of Revenue) * 365.
Prepaids and Other Current Assets as a Percentage of Sales: This percentage is used to project the Prepaid and Other Current Assets into the future by setting them to a percentage of the future Revenue.
Days Payable Outstanding (DPO): DPO tells you how long it takes a company to pay its suppliers. The larger this number, the longer amount of time the company is taking to pay its suppliers. A larger number is good because it means the company is not rushed to pay its bills and has time to invest its cash into other parts of the business before having to pay bills. The equation for DPO is: (Accounts Payable/Cost of Revenue) * 365.
Accrued Liabilities as as Percentage of Sales: This percentage is used to project the Accrued Liabilities into the future by setting them to a percentage of the future Revenue.
Other Current Liabilities as a Percentage of Sales: This percentage is used to project the Other Current Liabilities as a percentage of the future Revenue.
