Now that we’ve discussed the business, potential problems, and historical financial performance of Gamestop, we can attempt to predict the future to determine if the stock is under-, over-, or correctly valued in the stock market.
Below is the second half of the DCF Excel spreadsheet with the future projections for Gamestop’s financials and projected Free Cash Flow, followed by an explanation of how these numbers were found.

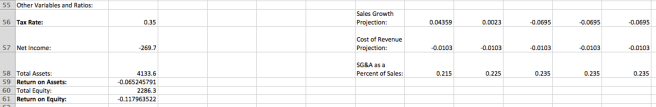
Future Sales: In your typical DCF model, you can just grow sales every year into the future using the average growth rate I list in cell G3 in the above spreadsheet. In reality, business rarely have revenue every year change by the same amount. Specifically with Gamestop, I chose to have temporary high growth in the near future because of all the new video game consoles being released in 2013 and the pent up videogame demand saved up for this occasion. However, for all the reasons listed in my “Supporting Arguments”, I decrease the company’s revenue in the future. For the specific percentages, I used Gamestop’s best and worst annual growth rates in the past five years.
Cost of Revenue and SG&A Projections: To find Gamestop’s future Earnings Before Taxes, Interest, Depreciation and Amortization, we need to subtract out its future Cost of Revenue and SG&A costs. To predict those costs, at the bottom of the spreadsheet I have included some extra information: The Cost of Revenue growth rate taken from the CAGR column and SG&A as a percentage of Revenue. SG&A as a percentage of Revenue is based on the average ratio of SG&A to Revenue from past years and using that average ratio in the future.
Depreciation and Amortization: Future D&A was set at 2% of future revenue. This is another standard number that you could try and modify if you see major changes in these expenses, but I did not see such reasons. If you compare the future projections of D&A using this “2% of future revenue metric”, you will see it is relatively close to the past values and thus seems like a reasonable assumption.
Capital Expenditures: Future Capex was set at 1.85% of future revenue, which was the average Capex over the previous five years.
Increase in Net Working Capital: This is the most complex part of the Free Cash Flow equation, so I have dedicated a separate post to explaining the details on how to project future changes in Net Working Capital.
The equation for Free Cash Flow is:
EBIAT
+ D&A
– Capex
– Increase in Net Working Capital
=Free Cash Flow.
The reason this works to find the company’s available cash flow:
EBIAT represents the company’s earnings that could be used to pay off any debts in the event of a liquidation (hence why “Interest” is not taken out, interest comes from those debts).
Capex is subtracted because it is a use of the company’s cash. Even though it can be considered cash spent wisely to improve the business, it is still less cash available to the owners (the stock holders).
The Increase in Net Working Capital is subtracted because an increase in NWC, like Capex, means cash has been used to either increase the company’s assets or decrease its liabilities. Both of these are not strictly good nor bad, but they are uses of cash that are not available for the investors to pocket.
However, the remaining cash is available for investors.
Using the steps and descriptions above for each row in the Excel spreadsheet model and every column representing the next five year’s of the company’s operations, we can use the simple math explained above and in the past to estimate future Free Cash Flow.
With our guesses for the company’s future profits, we can now determine what the stock price should be.
Next: The Future
Previous: Net Working Capital
